
The Trees of the Pisa Botanic Garden under Climate Change Scenarios: What Are We Walking into?


1
Pisa Botanic Garden and Museum, University of Pisa, Via Ghini 13, 56126 Pisa, Italy
2
Department of Biology, University of Pisa, Via Derna 1, 56126 Pisa, Italy
3
CIRSEC, Centre for Climatic Change Impact, University of Pisa, Via del Borghetto 80, 56124 Pisa, Italy
*
Author to whom correspondence should be addressed.
Sustainability 2023, 15(5), 4585; https://doi.org/10.3390/su15054585
Submission received: 2 February 2023
/
Revised: 1 March 2023
/
Accepted: 2 March 2023
/
Published: 3 March 2023
(This article belongs to the Section Air, Climate Change and Sustainability)
Abstract
:Botanical gardens are dynamic systems of high scientific, ecological, cultural, and historical value. They are irreplaceable places to cultivate, manage, study, and preserve tree diversity. One of the ongoing biggest challenges worldwide in managing and preserving trees is climate change, which exposes specimens to more stressful and severe environmental conditions, causing an increase in mortality. In our research, we aimed to assess the future climate change impact on the tree collection of Botanic Garden of Pisa in order to outline the expected consequences about tree cultivation and management. Under the most pessimistic scenario, in 2090 more than 60% of the tree species cultivated in the Botanic Garden of Pisa are expected to fall outside of their climatic niche. Future chances and pitfalls in managing urban green areas, focusing on the botanical garden community, are also explored.
1. Introduction
The scientific community has raised strong and unquestionable evidence of a pending dramatic change in global climate caused by anthropic activities affecting both ecosystems and biological diversity [1,2,3,4,5]. Recent estimates predict an increase in global mean temperature of 1.5 to 5 degrees Celsius (°C) [2] and significant changes in the hydrologic cycle [6] by the end of this century.
As highlighted by Primack and colleagues [7], botanical gardens and arboreta (hereafter simply referred as ‘botanical gardens’) play a key role in investigating climate change phenomena thanks to their large living plant collections. In addition, the scientific and horticultural expertise and experience of botanical garden staff are basically irreplaceable [8,9,10]. The range of scientific activities carried out by botanical gardens includes conservation, propagation, horticulture, seed science, systematics, taxonomy, genetics, education, restoration ecology, public engagement, sustainability, and social wellness promotion at the core of their institutional mission [11,12,13,14]. Botanical garden networks currently operating at the global scale, such as the Botanic Garden of Conservation International (hereafter, BGCI) and the Climate Change Alliance of Botanic Gardens [15], can implement the above-mentioned key role and expand the resources aimed at scientific investigations on climate change, being able to span across biomes and continents, to share data and experiences concerning threats, impacts, and their mitigation. Indeed, more than 2500 botanical gardens have been surveyed in the world [16,17], overall hosting 6 million accessions of living plants for a total of about 80,000 species, i.e., ca. 25% of the known vascular plant species [18,19].
Quickly changing climatic conditions are threatening the survival of several species at a long-term temporal scale [20]. Gao and colleagues [21] consider botanical gardens as ideal places to study the effects of rapid climate change on plants. In this context, trees are more susceptible to the effects of rapid climate change due to their long lifespans and constrained dispersal capabilities [22]. Extreme weather events can directly kill a tree or severely damage it; additionally, temperature and drought-related stresses are recognized as the major drivers for tree mortality [23]. Moreover, several botanical gardens are located in urban contexts or even in city centers, so that they will be likely subjected to temperature rise, as a consequence of the so-called ‘Urban Heat Island’ effect [24]. On the other hand, in the same urban context, trees provide relevant ecosystem services, such as water purification, erosion prevention, carbon sequestration, air temperature control, and regulation of air quality [13,25,26]. Botanical garden trees improve urban aesthetics, provide a central urban design function, and have a positive influence on the health and well-being of residents [8,14,27,28]. Moreover, trees managed by botanical gardens are a fundamental source of ex situ conservation of species threatened with extinction and—especially for specimens from previous centuries—irreplaceable heritage assets.
As expressed in ‘The Xishuangbanna Declaration on Botanical Gardens and Climate Change’ [29], the botanic garden community may help the world to mitigate and adapt to global warming. In this regard, Entwisle [30] stated that “I am not suggesting botanic gardens can save the world on their own but they are definitely part of the solution”. Unfortunately, while studies of urban tree vulnerability to climate change are rare and limited in scope [31], studies focused on botanical gardens are even more scarce. This study aimed to fill this gap, with two main objectives: (1) to assess the risk level of the trees in cultivation in the Botanic Garden of Pisa under climate change scenarios; and (2) to explore and share future chances and pitfalls in managing urban green areas, focusing on the botanical garden community.
2. Materials and Methods
2.1. Study Site
The Botanic Garden and Museum of the University of Pisa (WGS84: Lat. 43.719966 N, Long. 10.396161 E) was founded in 1543 and is the oldest academic botanical garden in the world by foundation date. It covers about 25,000 m2 and is structured in 7 sectors (Figure 1), hosting about 30 plant collections including more than 2000 species. One of the most relevant collections of the botanical garden is the Arboretum, hosting ca. 200 species. The localization and metadata associated with each specimen cultivated in the botanical garden are freely accessible through the online portal U-plant DISCOVER (https://uplantdiscover.sma.unipi.it/ accessed on 20 December 2022).
2.2. Statistical Analyses
To assess the suitability to the predicted future climate scenarios of tree species cultivated in the botanical garden, we performed the analyses through the Climate Assessment Tool (hereafter, CAT; [32]). As the first step, we extracted from our plant documentation system ‘U-plant’ the list of all the trees currently cultivated in the botanical garden. Then, the assessments based on models originating from two different occurrence datasets were carried out: (1) the ‘Global Biodiversity Information Facility’, with raw data cleansed and reviewed by BGCI (hereafter, GBIF BGCI) and (2) ‘Plant Search’, a global database of living plant in cultivation across botanical gardens and arboreta [33]. Once we reconstructed the climatic niche of each species under analysis, we forecasted future conditions according to two different climatic scenarios and temporal scales, namely SSP2/RCP4.5 projected to 2050 and SSP3/RCP7.0 projected to 2090, as provided by CAT [32]. The GBIF BGCI dataset was used as a proxy for the climatic niche of each species in its original wild distribution range, while Plant Search dataset is a reliable picture of the worldwide distribution of a species under cultivation. Concerning climate scenarios, SSP2/RCP4.5 optimistically assumes that steps have been taken to limit global emissions, while SSP2/RCP4.5 is the ‘worst-case scenario’, hypothesizing that no action has been taken to limit global emissions. As a baseline reference to allow inferences about the expected future trends, we checked the current climate, based on 2020 data (‘current scenario’). We removed from the analyses the cultivars and those species having an excessively low representation in the occurrence record dataset (n < 10). Eventually, we removed those tree species cultivated exclusively in greenhouses. The final list (Table S1) was composed of 126 species belonging to 42 families and pertaining to 213 individual trees. The nomenclature follows the checklists of Italian flora [34,35] for species recorded for Italy, while in all the other cases we referred to World Flora Online [36]. Extinction risk categories at the global level were assigned according to ‘The IUCN Red list of threatened species’ [37].
The main output of CAT tool is an assessment risk based on the comparison between the Mean Annual Temperature of the distribution of the target species (hereafter, MAT) and the projected mean annual temperature (BIO1) of the botanical garden based on a given climate scenario. We used the risk codes provided by [32] as follows:
- -
- Risk Code 0: indicates that there is no current record of this species growing at this MAT;
- -
- Risk Code 1: indicates that there are known records of this species growing at this MAT, but the latter is near the limit inferred from known records;
- -
- Risk Code 2: indicates that this species occurs at this MAT, albeit not optimal;
- -
- Risk Code 3: indicates that this species is mostly found growing at this MAT, which is expected to be optimal.
CAT also provides the following climatic variables from the niche of each species: maximum temperature of the hottest month (BIO5), minimum temperature of the coldest quarter (BIO11), annual precipitation (BIO12), and precipitation of the driest quarter (BIO17). Variable names and acronyms follow WorldClim 2 [38]. These variables allowed further exploring the expected response of species by also taking extreme temperatures and precipitations into account [39,40]. Differences in risk categories between the current climatic situation and both model projections were assessed through the Pearson’s chi-squared test, and significance was accepted at the p < 0.01 level. To assess the percentage of individual trees expected to change their living conditions under future climatic scenarios, a pairwise comparison among the current and future climate was applied for each species.
3. Results
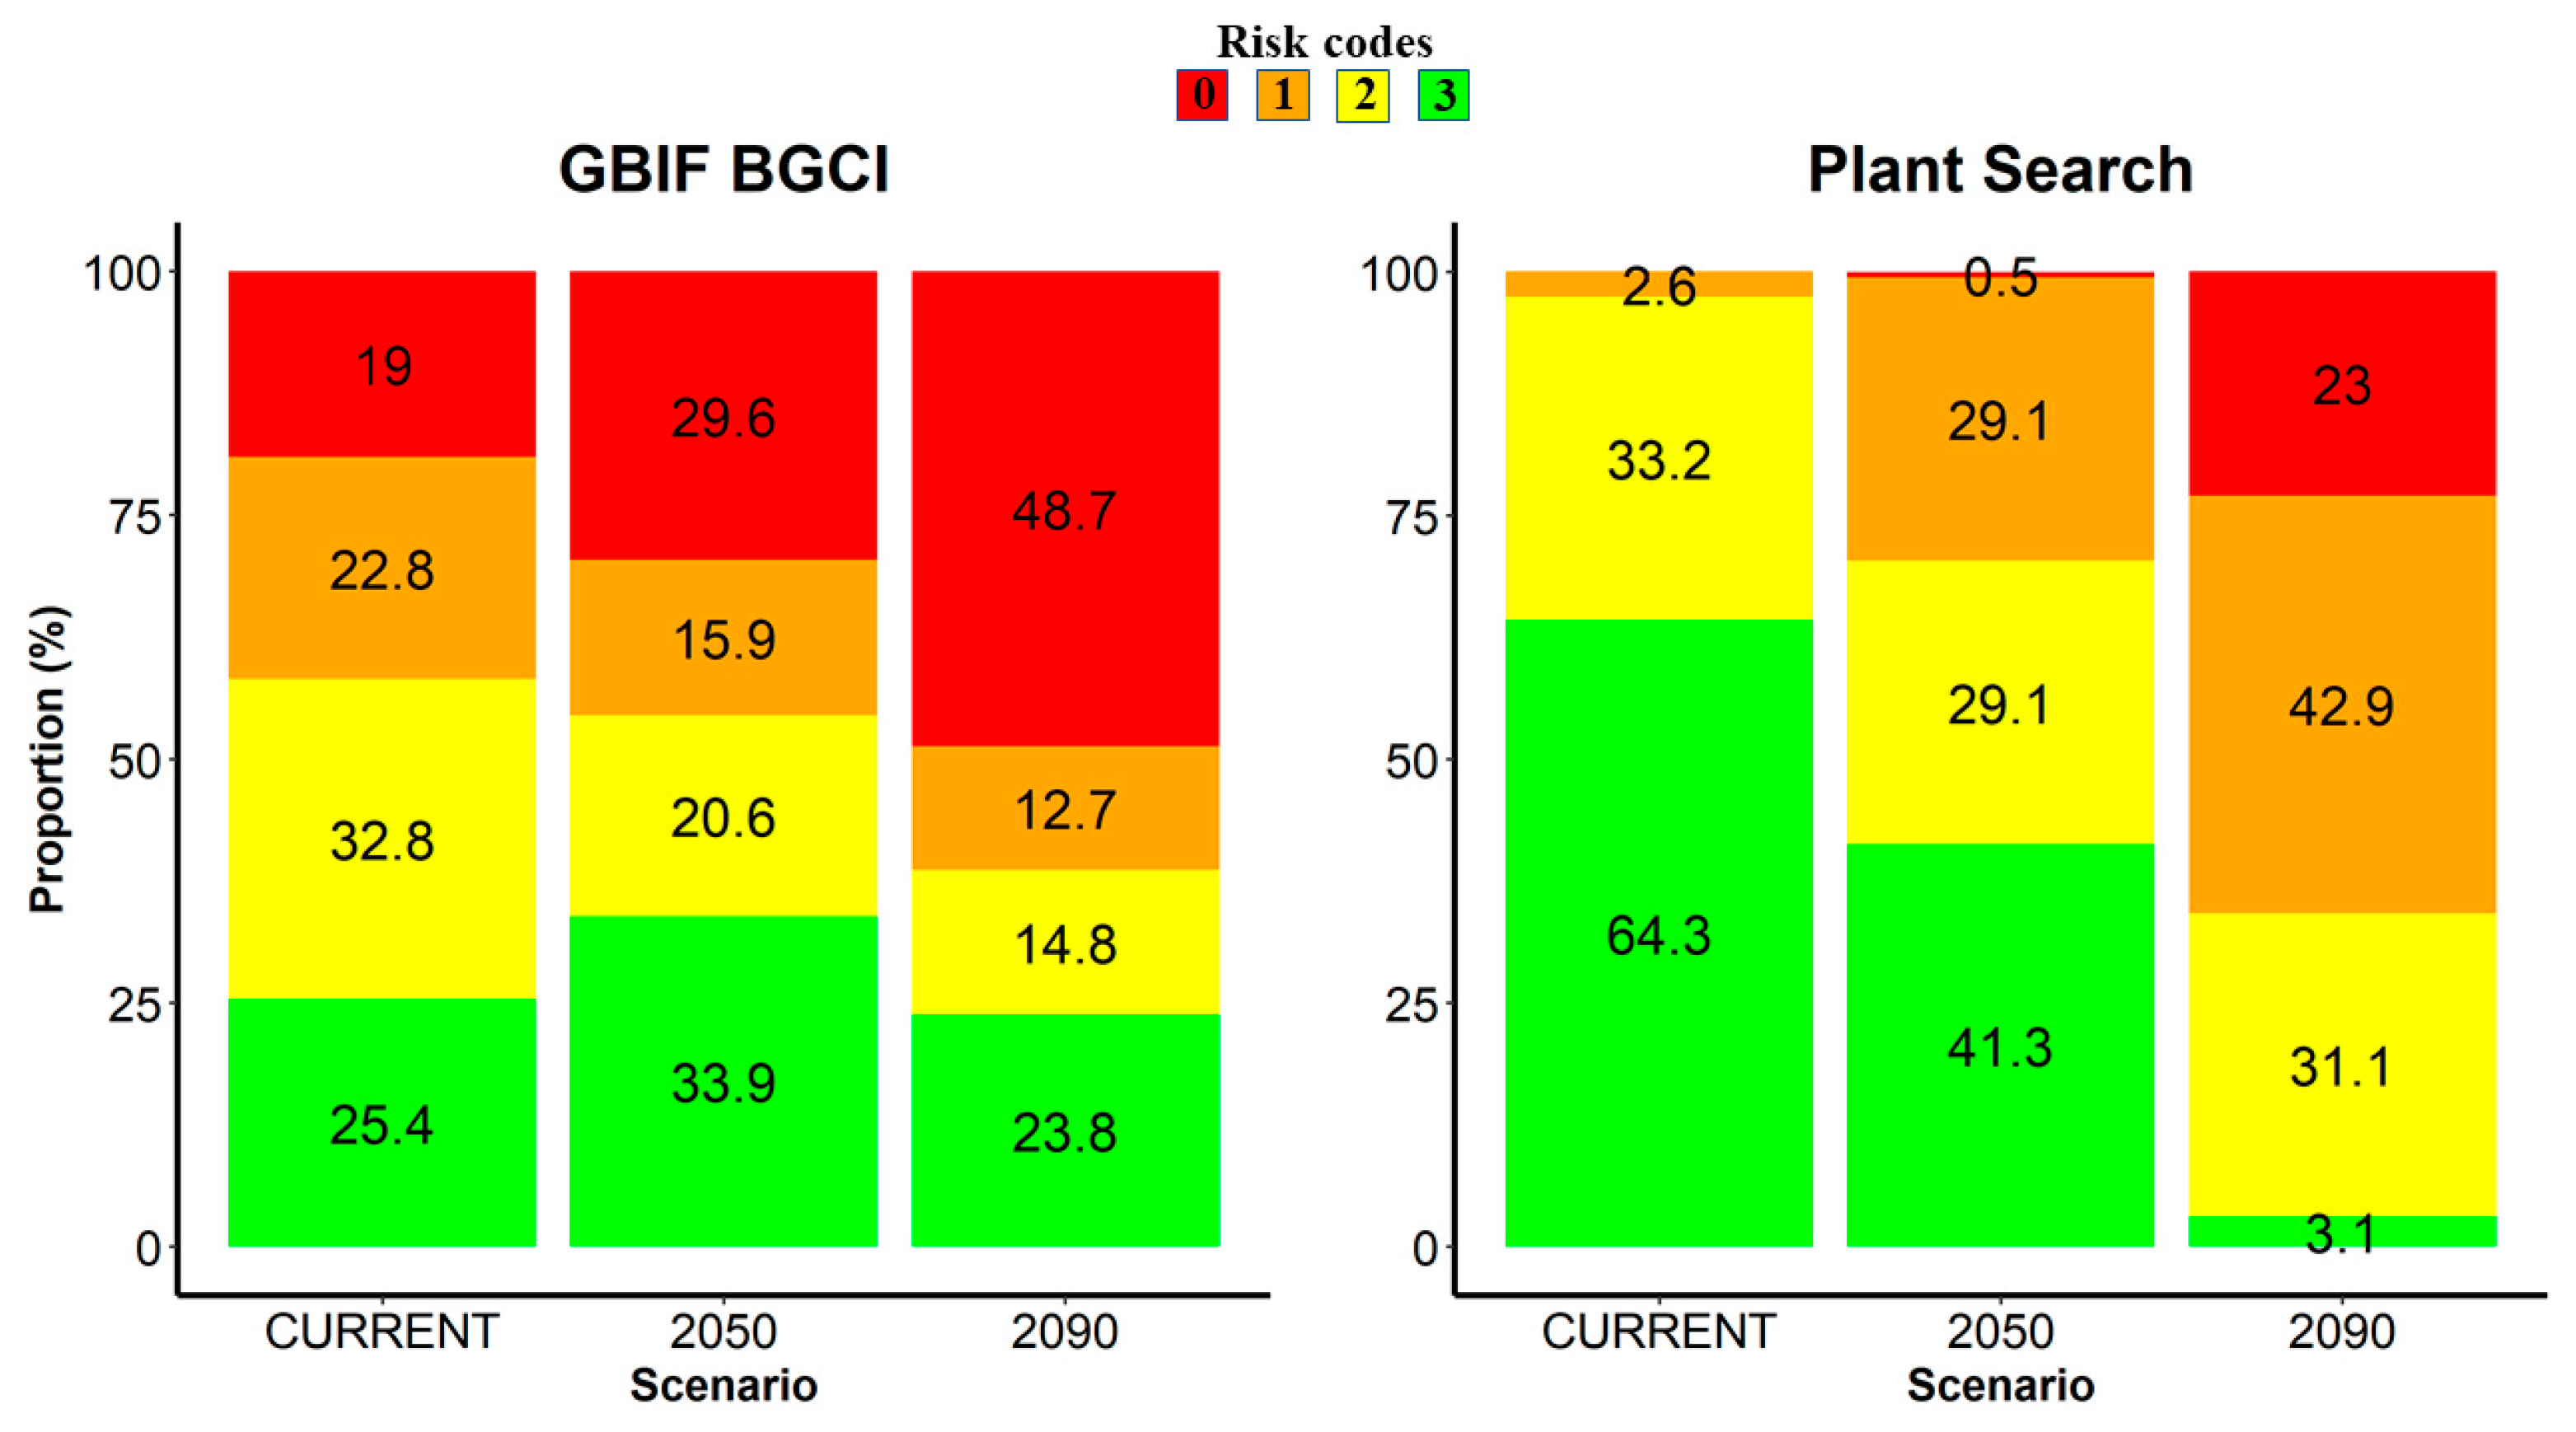
Concerning higher-risk categories (risk codes 0 and 1) assessed by the GBIF BGCI model, they scored 45.5% under the climatic scenario SSP2/RCP4.5 forecast to 2050, and 61.4% under the climatic scenario SSP3/RCP7.0 forecast to 2090 (Figure 2). In both cases, significant differences compared with the current climate were highlighted (p < 0.01 and p < 0.00001, respectively). For what concerns the Plant Search model, higher-risk categories scored 29.6% (SSP2/RCP4.5 to 2050) and 65.8% (SSP3/RCP7.0 to 2090), respectively (Figure 2). In both cases, significant differences compared with the current climate were highlighted (p < 0.00001).
According to scenario SSP2/RCP4.5, in 2050 the percentage of specimens expected to worsen their climatic conditions ranges from 36.5% (GBIF BGCI) to 49.0% (Plant Search). On the contrary, a portion between 0.5% (Plant Search) and 36.0% (GBIF BGCI) are expected to improve their climatic conditions. Concerning predictions forecast to 2090 (scenario SSP3/RCP7.0), up to 95.9% of the specimens are expected to worsen their living condition (Table 1).
There are 12 species threatened with extinction at the global level. Most of them are assessed as Endangered (EN, n = 4) or Near Threatened (NT, n = 4), followed by Vulnerable (VU, n = 3) and Critically endangered (CR, n = 1). According to GBIF BGCI model, in 2050 (scenario SSP2/RCP4.5) 18.2% of the species are predicted to fall within the highest risk (code 0) and 45.5% in risk code 1, while in 2090 (scenario SSP3/RCP7.0) to score 72.3% and 18.2%, respectively. Concerning the Plant Search model, in 2050 (scenario SSP2/RCP4.5) 9.1% of the species are predicted to fall within the highest risk (code 0) and 36.4% in risk code 1, while in 2050 (scenario SSP3/RCP7.0) to score 27.3% and 63.6%, respectively (Figure 3).
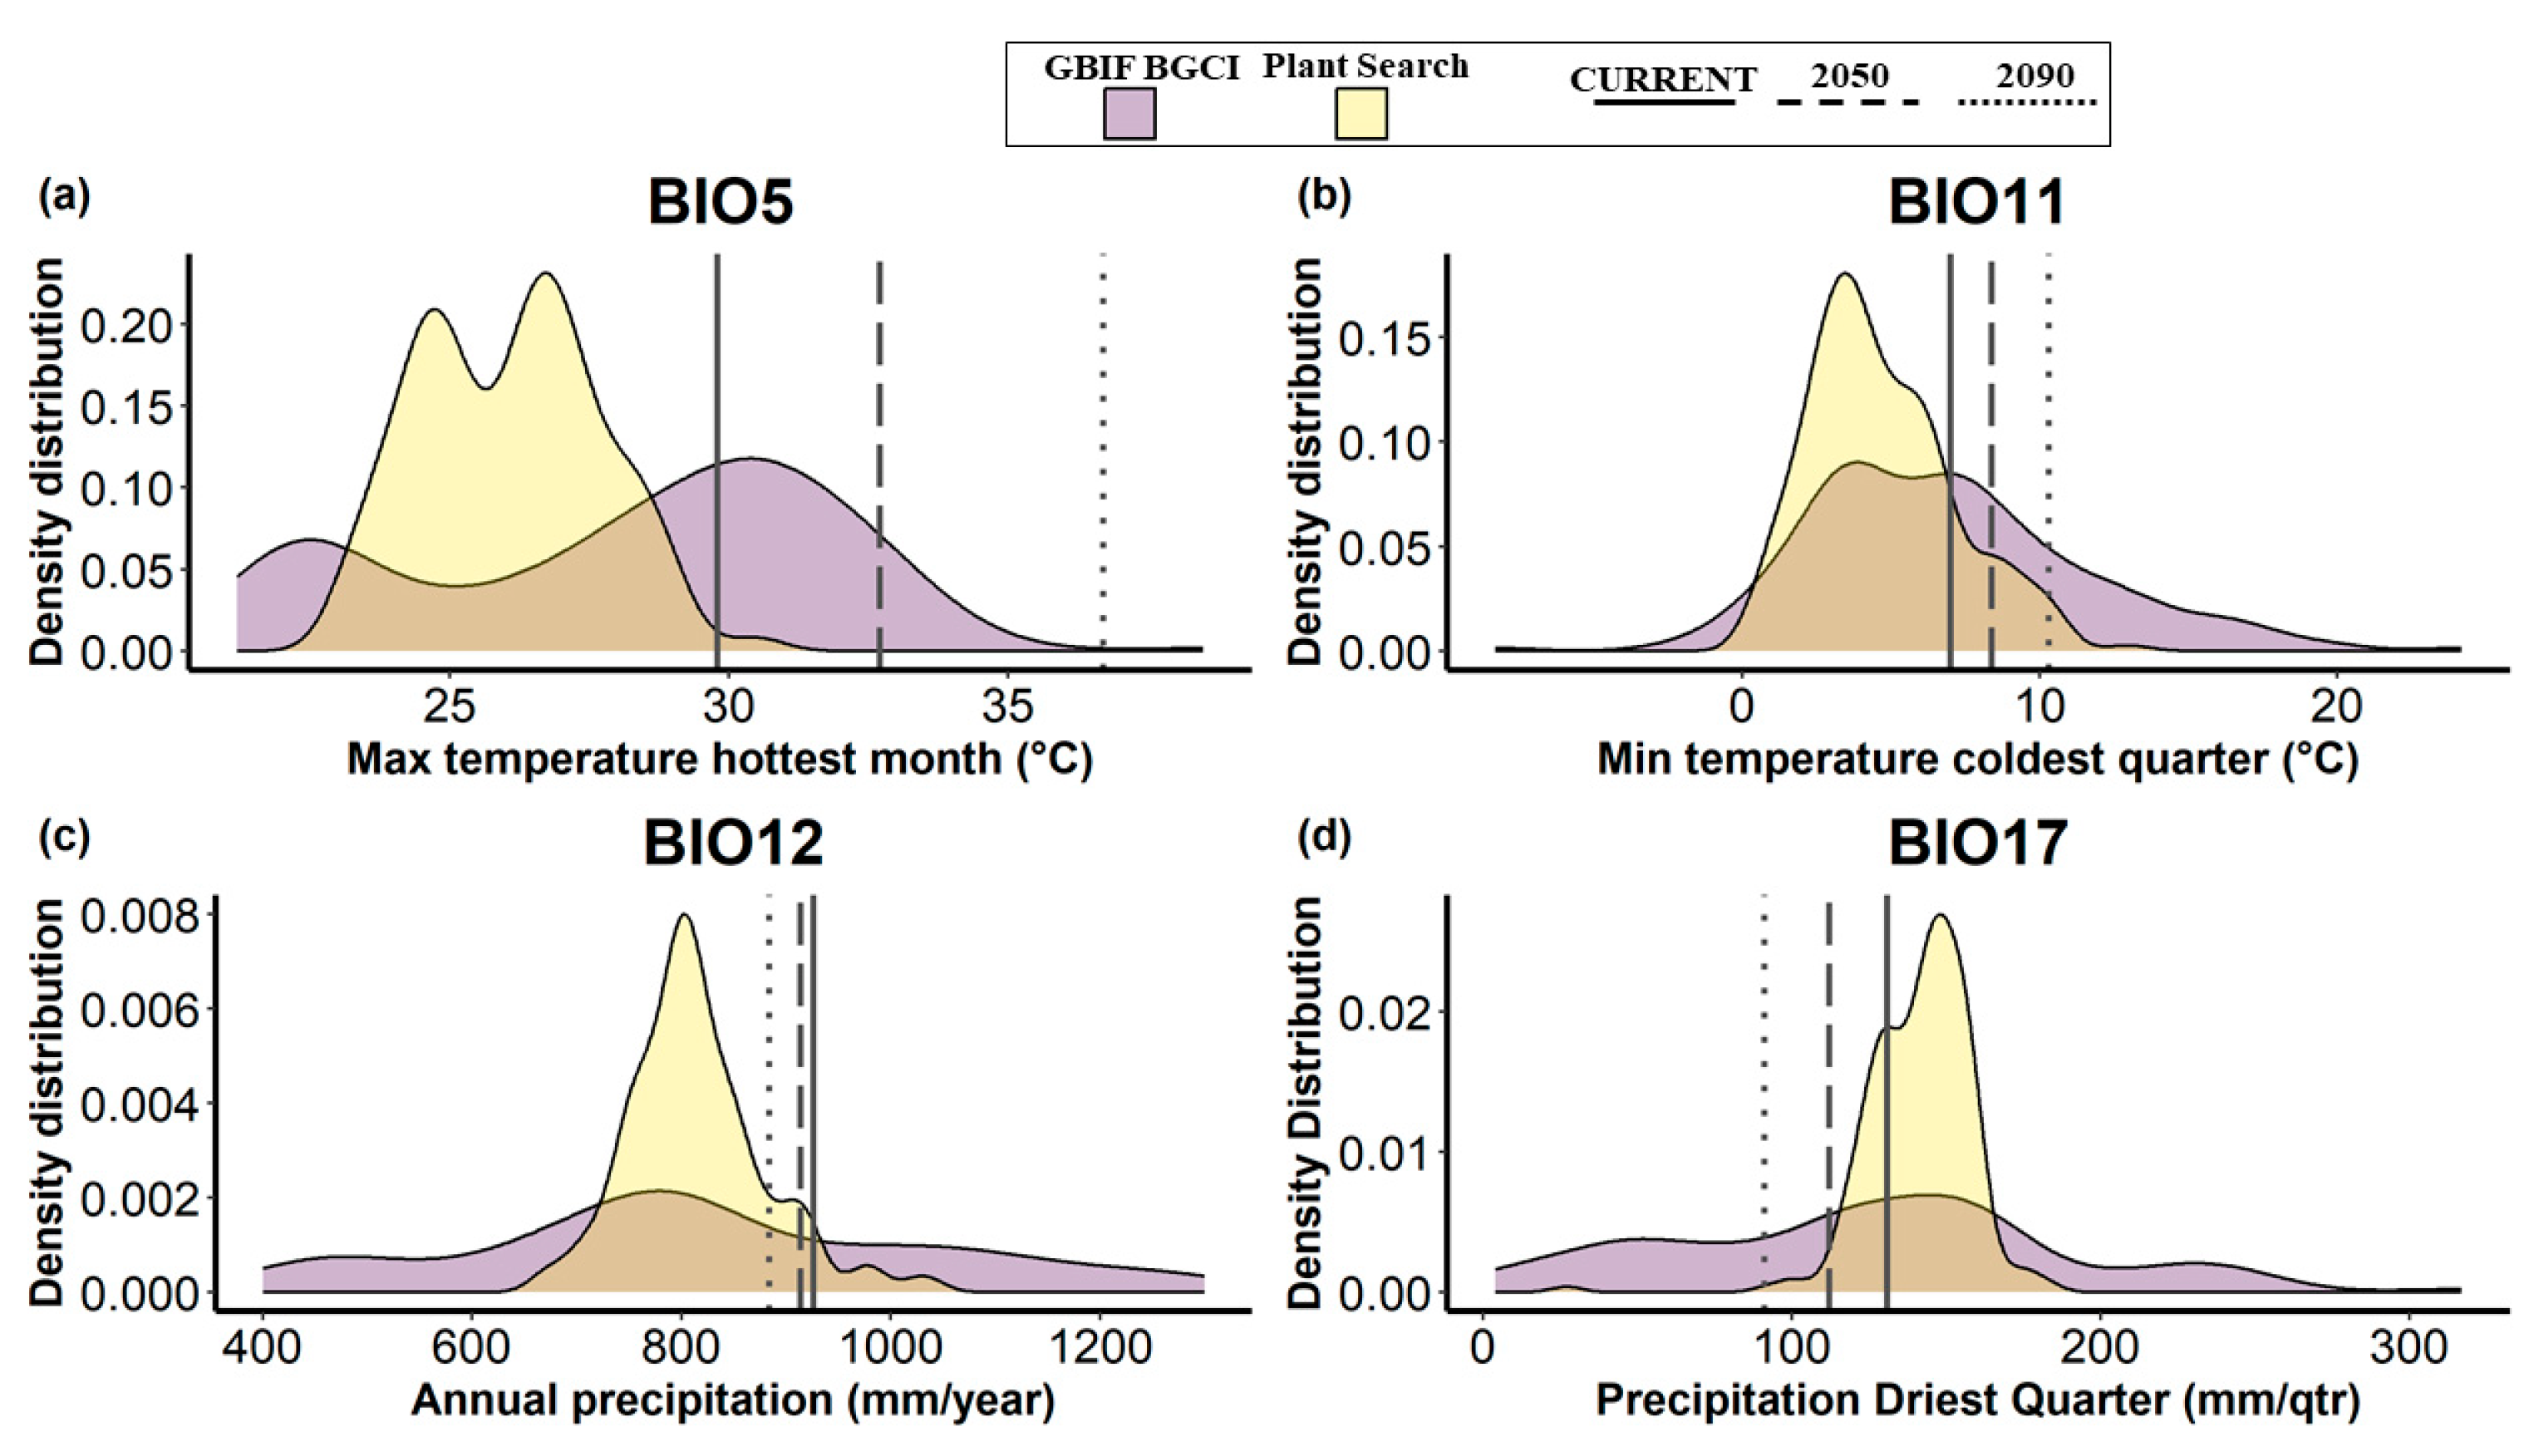
Concerning the predicted environmental variables for the botanical garden (vertical lines in Figure 4), the ‘maximum temperature of the hottest month’ (BIO5), the ‘minimum temperature of the coldest quarter’ (BIO11), and the ‘precipitation of the driest quarter’ (BIO17) showed an increasing discrepancy over time towards the distribution of the optimal environmental values of the species currently in cultivation in the garden. The opposite trend was observed for annual precipitation (BIO12), where the future values forecast for the botanical garden showed a shift towards the optimal values for the species in cultivation. The density distribution of the environmental values related to the GBIF BGCI occurrence dataset showed a wider width along the x-axis than Plant Search.
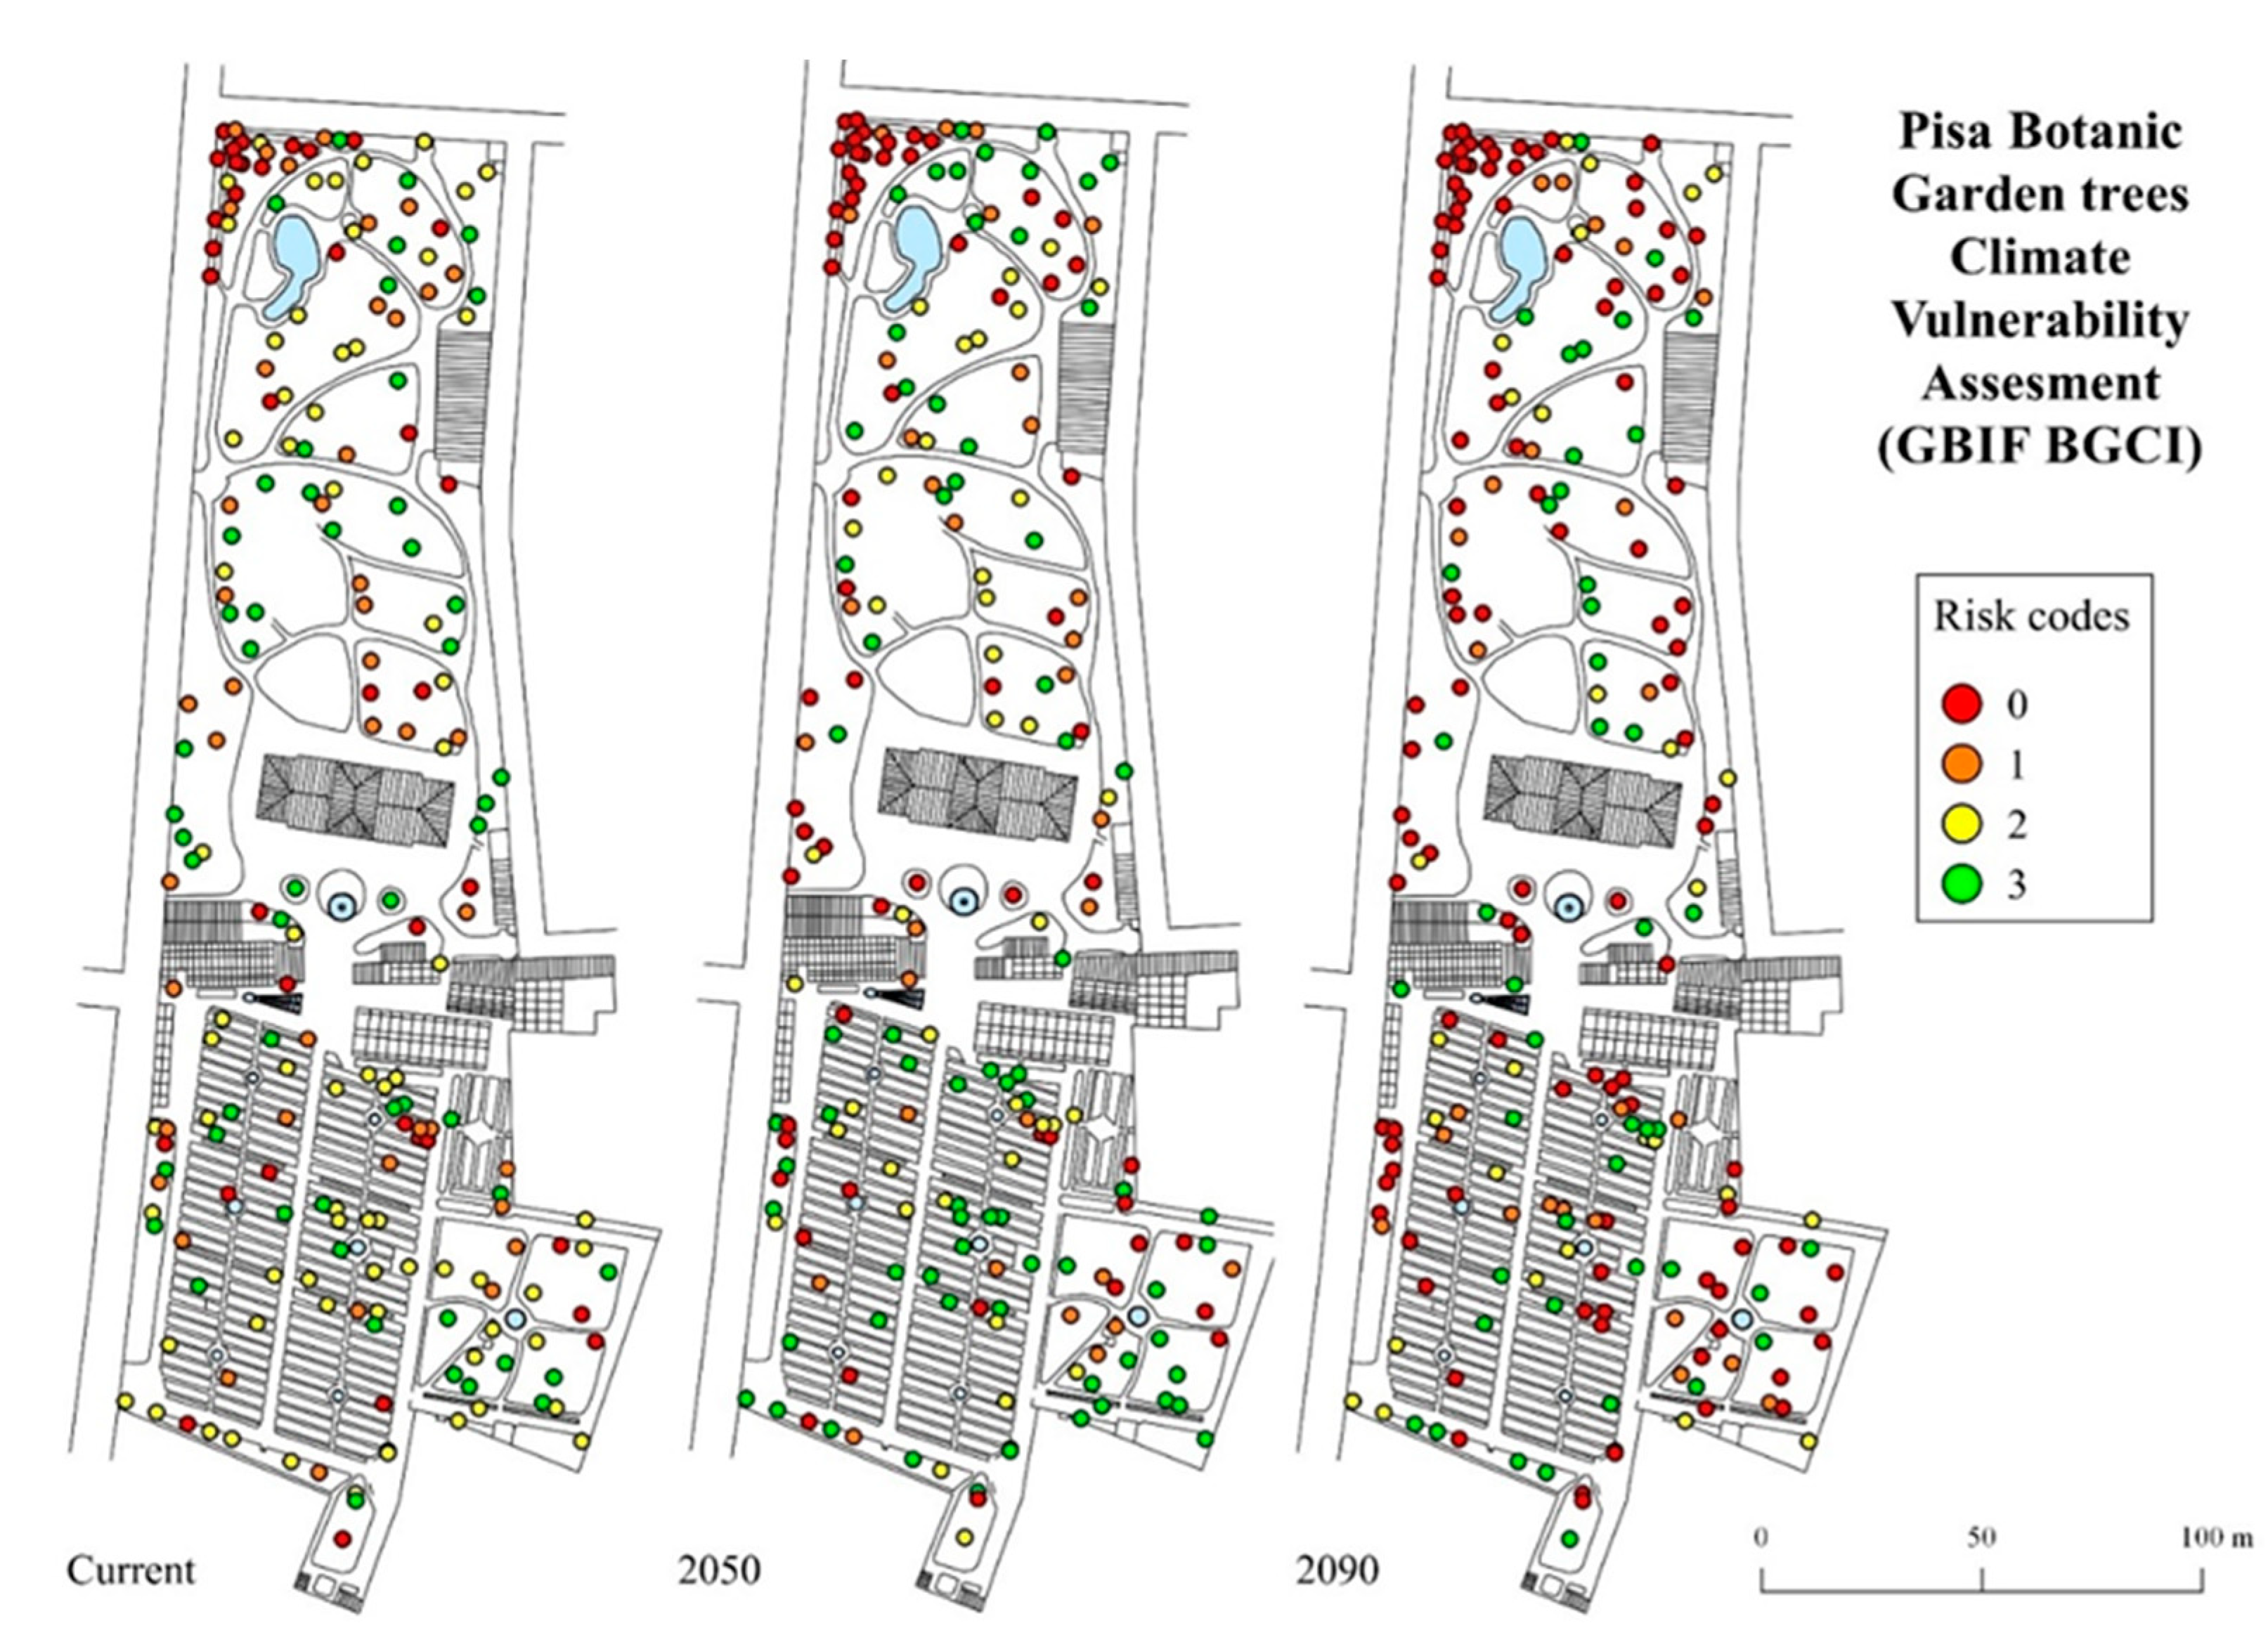
Climate vulnerability maps showing the localization of each individual tree in the botanical garden and their risk categories, as obtained from the GBIF BGCI model, are shown in Figure 5; maps obtained from the Plant Search model are provided in Supplementary Figure S1.
4. Discussion
4.1. General Considerations
George Box stated, in his seminal work, “Since all models are wrong the scientist must be alert to what is importantly wrong. It is inappropriate to be concerned about mice when there are tigers abroad” [41]. Under this perspective, in our research the mice are the model caveats, while the tigers are the climate change impacts, either experienced or forecasted. The survival of specimens in cultivation and the conservation of plant diversity are outstanding concerns in botanical gardens, especially under global change [28,42]. This work aimed to assess the climate change impact on the trees of the Botanic Garden of Pisa in order to shed light on the future trends and to outline the expected consequences about the cultivation and management of these specimens. Both the explored models concurred in highlighting a general trend of relative stability in 2050 by assuming an optimistic scenario of reduced emissions. However, a significant worsening by the end of this century is expected under the most pessimistic scenario. In this latter case, more than 60% of the trees currently cultivated in the botanical garden will be outside their own climatic niche, or at least in a condition of environmental marginality. Irrespectively of the models performed, we observed a general trend of deterioration of the climatic suitability of species of conservation interest (Figure 3), which comprise an important target for a botanical garden.
As demonstrated in the literature, climate extremes may be more important than average values when predicting species range shifts (e.g., [43,44]). Individuals can be directly impacted by climate extremes, either physiologically or mechanically [45,46], determining widespread mortality, reduced growth, or defoliation. According to the projected trends of environmental factors (BIO1, BIO5, BIO11, and BIO17), both increasing temperatures and drought severity will expose the trees to significant stress. Particularly, the expected increase of the maximum temperature of the hottest month (BIO5), coupled with a decrease of the precipitation of the driest quarter (BIO17), will make summer periods highly problematic.
4.2. Why We Have to Be More Pessimistic than Predictions
Trees in urban environments have to cope with a large range of additional stresses that are less pronounced, or even absent, in forests. First, environmental conditions in a city are more extreme (‘Urban Heat Island’ effect; [24]) and can lead to an increased mortality risk [47]. As argued by [21], the relationship among climate change and other parameters related to human disturbances is a complex multifactorial system. Indeed, several extra-climatic factors can simultaneously put under pressure the trees in the garden: air pollutants, soil sealing, soil compaction, limited rooting space, pathogens, and pests. The degree of these stresses may vary from place to place [48], but in a botanical garden they can reach a high magnitude.
The Botanic Garden of Pisa experiences an average of more than 60,000 visitors per year, causing important phenomena of soil compaction and interferences with rooting space, which are a serious problem for the health of trees [49].
There is strong evidence that climate change extends the distribution range of some pests [2]. For instance, a magnificent individual of Jubaea chilensis (Molina) Baill., planted in 1890 in the central square of our botanical garden by Giovanni Arcangeli (1840–1921) together with a sibling specimen, was irreversibly damaged in 2017 by Rhynchophorus ferrugineus Olivier, 1790. More recently, we recorded, for the first-time, injuries caused by Paysandisia archon (Burmeister, 1880) on a specimen of Trachycarpus fortunei (Hook.) H.Wendl.
4.3. Why We Can Be More Optimistic than Predictions
Although temperature effects in outdoor spaces are extremely hard to control, some horticultural activities can improve the cultivation results and in general tree health. For example, irrigation and proper soil drainage can reduce water stress [50], such as the design and application of even more optimized watering techniques, in order to reduce the water footprint in a sustainability perspective. Science and technology may help a lot to optimize the use of water resources, such as water regulations according to soil location features, to store water from rainfall events, and irrigation techniques and programs [51,52,53].
Again, being that soil biodiversity is essential to establish healthy plant communities and to mitigate the harmful effects of pathogens and soil compaction, the horticultural staff can implement a set of ameliorative approaches, such as compost supplementation, mulching, aerating, and managing the soil pH. Among the main issues potentially affecting a garden, there is the neglected or incorrect management of gardens [28] and literature therein. However, botanical gardens spend resources and efforts in staff education and training to reach the standards stated by their institutional mission [12,51,54], also concerning awareness promotion on climate change effects or other abiotic/biotic environmental threats [42,51]. The skills and attitudes of the botanical garden staff can ensure the proper management of trees: correctly performed pruning in the early stages of a tree’s life can enhance its growth rate [55], while incorrect pruning can leave a large and slow-to-heal wound, exposing a tree to diseases [56,57].
Concerning the models, a note of caution is needed. The PlantSearch database stores more records for the Northern Hemisphere and cooler climates than for the Southern Hemisphere and warmer climates [32]. As a consequence, a potential bias could skew the inferred climatic niches towards colder climates.
Phenotypic plasticity is generally assumed to have positive implications for tree species adaptation facing environmental change [58,59] by creating a sort of mortality-buffer [60]. Accordingly, some species predicted to have low/null climatic suitability under future climate conditions could perform well, or at least survive. In a general perspective, we might expect for a pool of tree species the activation of a set of compensating mechanisms able to overcome climate change effects. For example, plant plasticity could be relevant for adaptation to increased temperatures and drought by modifying leaf traits, thus reducing the water loss due to transpiration [61], by implementing a larger root network in order to enhance access to water and nutrients [62], or through an embolism-resistant xylem [63,64].
5. Conclusions
Plant selection in a botanical garden should carefully consider species requirements both for the present and future climatic conditions [51]. In particular, tree replacement should be planned in the long term by managers [42]. An inspiring project comes from the Melbourne Botanic Gardens, namely the ‘Landscape Succession Strategy’ [65], which has the main goal to retain a similar taxonomic diversity of species but also to reshape the collections by planning the substitution of predicted unsuitable species so that by 2036 at least 75% of the species are suitable for the climate in 2090 (see [51]).
Through the Botanic Garden and Museum of the University of Pisa as study case, we provided evidence that botanical gardens are going to face a concerning future of tree decline involving many species. This trend might also weaken conservation efforts of these institutions. Improvements in trees management (1) to mitigate climatic threats, (2) to design projects to rationally decide on which species to invest time and resources in, and (3) to implement sustainable management are crucial. It is time to act and to join forces to cope with climate change.
Supplementary Materials
The following supporting information can be downloaded at: https://www.mdpi.com/article/10.3390/su15054585/s1, Table S1: list of analyzed tree species; Figure S1: Plant Search trees’ Climate Vulnerability Assessment maps.
Author Contributions
Conceptualization, M.D. and L.P.; data collection, N.W. and L.C.; formal analysis, M.D.; GIS mapping, N.W.; writing—original draft preparation, M.D.; writing—review and editing, M.D., N.W., L.C. and L.P.; visualization, M.D. and N.W; supervision, L.P. All authors have read and agreed to the published version of the manuscript.
Funding
This research received no external funding.
Institutional Review Board Statement
Not applicable.
Informed Consent Statement
Not applicable.
Data Availability Statement
Climatic data and projected models are available at https://cat.bgci.org (Climate Assessment Tool), while the list of cultivated trees in the Botanic Garden of Pisa can be extrapolated from U-plant DISCOVER (https://uplantdiscover.sma.unipi.it/).
Conflicts of Interest
The authors declare no conflict of interest.
References
- Bellard, C.; Bertelsmeier, C.; Leadley, P.; Thuiller, W.; Courchamp, F. Impacts of climate change on the future of biodiversity. Ecol. Lett. 2012, 15, 365–377. [Google Scholar] [CrossRef] [PubMed] [Green Version]
- Pörtner, H.-O.; Roberts, D.C.; Tignor, M.M.B.; Poloczanska, E.S.; Mintenbeck, K.; Alegría, A.; Craig, M.; Langsdorf, S.; Löschke, S.; Möller, V.; et al. Climate Change 2022: Impacts, Adaptation and Vulnerability. Contribution of Working Group II to the Sixth Assessment Report of the Intergovernmental Panel on Climate Change; Cambridge University Press: Cambridge, UK; New York, NY, USA, 2022. [Google Scholar]
- Simpson, N.P.; Mach, K.J.; Constable, A.; Hess, J.; Hogarth, R.; Howden, M.; Lawrence, J.; Lempert, R.J.; Muccione, V.; Mackey, B.; et al. A framework for complex climate change risk assessment. One Earth 2021, 4, 489–501. [Google Scholar] [CrossRef]
- Bedini, G.; Astuti, G.; Carta, A.; Ciccarelli, D.; D’Antraccoli, M.; Dolci, D.; Peruzzi, L. Sensitivity of wild plants to climate change. Agrochimica 2019, 2019, 165–170. [Google Scholar]
- Peruzzi, L.; Dolci, D.; Chiarucci, A. Potential climatic and elevational range shifts in the Italian narrow endemic Bellevalia webbiana (Asparagaceae) under climate change scenarios. Nat. Conserv. 2022, 50, 145–157. [Google Scholar] [CrossRef]
- Trenberth, K.E.; Dai, A.; Rasmussen, R.M.; Parsons, D.B. The changing character of precipitation. Bull. Am. Meteorol. Soc. 2003, 84, 1205–1218. [Google Scholar] [CrossRef]
- Primack, R.B.; Ellwood, E.R.; Gallinat, A.S.; Miller-Rushing, A.J. The growing and vital role of botanical gardens in climate change research. New Phytol. 2021, 231, 917–932. [Google Scholar] [CrossRef]
- Cannon, C.H.; Kua, C.-S. Botanic gardens should lead the way to create a “Garden Earth” in the Anthropocene. Plant Divers. 2017, 39, 331–337. [Google Scholar] [CrossRef]
- Culley, T.M.; Dreisilker, K.; Clair Ryan, M.; Schuler, J.A.; Cavallin, N.; Gettig, R.; Havens, K.; Landel, H.; Shultz, B. The potential role of public gardens as sentinels of plant invasion. Biodivers. Conserv. 2022, 31, 1829–1844. [Google Scholar] [CrossRef]
- Raschke, A.B.; Pegram, K.V.; Melkonoff, N.A.; Davis, J.; Blackwell, S.A. Collaborative conservation by botanical gardens: Unique opportunities for local to global impacts. J. Zool. Bot. Gard. 2022, 3, 463–487. [Google Scholar] [CrossRef]
- Chen, G.; Sun, W. The role of botanical gardens in scientific research, conservation, and citizen science. Plant Divers. 2018, 40, 181–188. [Google Scholar] [CrossRef]
- Hohn, T.C. Curatorial Practices for Botanical Gardens; Rowman Altamira: Walnut Creek, CA, USA, 2008; ISBN 978-0-7591-1063-2. [Google Scholar]
- Qumsiyeh, M.; Handal, E.; Chang, J.; Abualia, K.; Najajrah, M.; Abusarhan, M. Role of museums and botanical gardens in ecosystem services in developing countries: Case study and outlook. Int. J. Environ. Stud. 2017, 74, 340–350. [Google Scholar] [CrossRef]
- Wyse Jackson, P.; Sutherland, L. Role of botanic gardens. In Encyclopedia of Biodiversity; Levin, S.A., Ed.; Academic Press: Waltham, MA, USA, 2017; Volume 6, pp. 504–521. [Google Scholar]
- Symes, P.; Hart, C. The Climate Change Alliance: Botanic garden horticulturists as agents for change. Sibbaldia 2021, 20, 95–122. [Google Scholar] [CrossRef]
- Miller, A.J.; Novy, A.; Glover, J.; Kellogg, E.A.; Maul, J.E.; Raven, P.; Jackson, P.W. Expanding the role of botanical gardens in the future of food. Nat. Plants 2015, 1, 15078. [Google Scholar] [CrossRef] [PubMed]
- Golding, J.; Güsewell, S.; Kreft, H.; Kuzevanov, V.Y.; Lehvävirta, S.; Parmentier, I.; Pautasso, M. Species-richness patterns of the living collections of the world’s botanic gardens: A matter of socio-economics? Ann. Bot. 2010, 105, 689–696. [Google Scholar] [CrossRef] [PubMed]
- Christenhusz, M.J.M.; Byng, J.W. The number of known plants species in the world and its annual increase. Phytotaxa 2016, 261, 201–217. [Google Scholar] [CrossRef] [Green Version]
- Jackson, P.W.; Bridge, B.; Dennis, F.; Leadlay, E.; Hobson, C.; Holland, F.; Pendry, T.; Skilton, J.; Sutherland, L.; Willison, J.; et al. An international review of the ex situ plant collections of the botanic gardens of the world-: Reviewing the plant genetic resource collections of botanic gardens worldwide, as a contribution to decision V/26 on Access to Genetic Resources of the Conference of the Parties to the Convention on Biological Diversity—Part 1: Overview and analysis. Bot. Gard. Conserv. News 2001, 3, 22–33. [Google Scholar]
- Urban, M.C. Climate change. Accelerating extinction risk from climate change. Science 2015, 348, 571–573. [Google Scholar] [CrossRef] [Green Version]
- Gao, J.-G.; Liu, H.; Wang, N.; Yang, J.; Zhang, X.-L. Plant extinction excels plant speciation in the Anthropocene. BMC Plant Biol. 2020, 20, 430. [Google Scholar] [CrossRef]
- Oldfield, S.; Newton, A.C. Integrated Conservation of Tree Species by Botanic Gardens: A Reference Manual; Botanic Gardens Conservation International: Richmond, UK, 2012. [Google Scholar]
- Seidl, R.; Thom, D.; Kautz, M.; Martin-Benito, D.; Peltoniemi, M.; Vacchiano, G.; Wild, J.; Ascoli, D.; Petr, M.; Honkaniemi, J.; et al. Forest disturbances under climate change. Nat. Clim. Chang. 2017, 7, 395–402. [Google Scholar] [CrossRef] [Green Version]
- Oleson, K.W.; Bonan, G.B.; Feddema, J.; Jackson, T. An examination of urban heat island characteristics in a global climate model. Int. J. Climatol. 2011, 31, 1848–1865. [Google Scholar] [CrossRef] [Green Version]
- Ward, C.D.; Parker, C.M.; Shackleton, C.M. The use and appreciation of botanical gardens as urban green spaces in South Africa. Urban For. Urban Green. 2010, 9, 49–55. [Google Scholar] [CrossRef] [Green Version]
- Haase, D.; Larondelle, N.; Andersson, E.; Artmann, M.; Borgström, S.; Breuste, J.; Gomez-Baggethun, E.; Gren, Å.; Hamstead, Z.; Hansen, R.; et al. A quantitative review of urban ecosystem service assessments: Concepts, models, and implementation. AMBIO 2014, 43, 413–433. [Google Scholar] [CrossRef] [PubMed] [Green Version]
- Hall, C.; Knuth, M. An update of the literature supporting the well-being benefits of plants: A review of the emotional and mental health benefits of plants. J. Environ. Hortic. 2019, 37, 30–38. [Google Scholar] [CrossRef]
- Carrari, E.; Aglietti, C.; Bellandi, A.; Dibari, C.; Ferrini, F.; Fineschi, S.; Galeotti, P.; Giuntoli, A.; Manganelli Del Fa, R.; Moriondo, M.; et al. The management of plants and their impact on monuments in historic gardens: Current threats and solutions. Urban For. Urban Green. 2022, 76, 127727. [Google Scholar] [CrossRef]
- Xishuangbanna International Symposium Participants. The Xishuangbanna Declaration on Botanical Gardens and Climate Change. In Proceedings of the Third Xishuangbanna International Symposium, Botanical Gardens and Climate Change, Xishuangbanna, China, 13–16 January 2014; Available online: https://www.bgci.org/files/Worldwide/News/2014/XDBGCC.pdf (accessed on 15 November 2022).
- Entwisle, T.J. R-E-S-P-E-C-T: How Royal Botanic Gardens Victoria is responding to climate change. Plants People Planet 2019, 1, 77–83. [Google Scholar] [CrossRef] [Green Version]
- Esperon-Rodriguez, M.; Rymer, P.D.; Power, S.A.; Barton, D.N.; Cariñanos, P.; Dobbs, C.; Eleuterio, A.A.; Escobedo, F.J.; Hauer, R.; Hermy, M.; et al. Assessing climate risk to support urban forests in a changing climate. Plants People Planet 2022, 4, 201–213. [Google Scholar] [CrossRef]
- Climate Change Alliance of Botanic Gardens. Climate Assessment Tool v1. Available online: https://cat.bgci.org (accessed on 19 October 2022).
- BGCI PlantSearch Online Database. Available online: https://tools.bgci.org/plant_search.php (accessed on 20 December 2022).
- Bartolucci, F.; Peruzzi, L.; Galasso, G.; Albano, A.; Alessandrini, A.; Ardenghi, N.M.G.; Astuti, G.; Bacchetta, G.; Ballelli, S.; Banfi, E.; et al. An updated checklist of the vascular flora native to Italy. Plant Biosyst. 2018, 152, 179–303. [Google Scholar] [CrossRef]
- Galasso, G.; Conti, F.; Peruzzi, L.; Ardenghi, N.M.G.; Banfi, E.; Celesti-Grapow, L.; Albano, A.; Alessandrini, A.; Bacchetta, G.; Ballelli, S.; et al. An updated checklist of the vascular flora alien to Italy. Plant Biosyst. 2018, 152, 556–592. [Google Scholar] [CrossRef]
- WFO World Flora Online. Available online: http://www.worldfloraonline.org (accessed on 4 December 2022).
- IUCN. The IUCN Red List of Threatened Species. Available online: https://www.iucnredlist.org/en (accessed on 30 November 2022).
- Fick, S.E.; Hijmans, R.J. WorldClim 2: New 1-Km Spatial Resolution Climate Surfaces for Global Land Areas. Int. J. Climatol. 2017, 37, 4302–4315. [Google Scholar] [CrossRef]
- Crockett, J.L.; Westerling, A.L. Greater temperature and precipitation extremes intensify western U.S. droughts, wildfire severity, and Sierra Nevada tree mortality. J. Clim. 2018, 31, 341–354. [Google Scholar] [CrossRef]
- Zimmermann, N.E.; Yoccoz, N.G.; Edwards, T.C.; Meier, E.S.; Thuiller, W.; Guisan, A.; Schmatz, D.R.; Pearman, P.B. Climatic extremes improve predictions of spatial patterns of tree species. Proc. Natl. Acad. Sci. USA 2009, 106, 19723–19728. [Google Scholar] [CrossRef] [Green Version]
- Box, G.E.P. Science and Statistics. J. Am. Stat. Assoc. 1976, 71, 791–799. [Google Scholar] [CrossRef]
- Martin, S. Climate ready? Exploring the impacts and lessons from recent extreme events at Royal Botanic Garden Edinburgh for climate change adaptation in the horticulture sector. Sibbaldia 2014, 12, 155–170. [Google Scholar] [CrossRef]
- Felton, A.J.; Smith, M.D. Integrating plant ecological responses to climate extremes from individual to ecosystem levels. Philos. Trans. R. Soc. B Biol. Sci. 2017, 372, 20160142. [Google Scholar] [CrossRef] [PubMed] [Green Version]
- Beigaitė, R.; Tang, H.; Bryn, A.; Skarpaas, O.; Stordal, F.; Bjerke, J.W.; Žliobaitė, I. Identifying climate thresholds for dominant natural vegetation types at the global scale using machine learning: Average climate versus extremes. Glob. Chang. Biol. 2022, 28, 3557–3579. [Google Scholar] [CrossRef] [PubMed]
- Levitt, J. Responses of Plants to Environmental Stresses; Academic Press: New York, NY, USA, 1980; Volume 2. [Google Scholar]
- Polley, H.W.; Derner, J.D.; Jackson, R.B.; Wilsey, B.J.; Fay, P.A. Impacts of climate change drivers on C4 grassland productivity: Scaling driver effects through the plant community. J. Exp. Bot. 2014, 65, 3415–3424. [Google Scholar] [CrossRef] [Green Version]
- Gillner, S.; Bräuning, A.; Roloff, A. Dendrochronological analysis of urban trees: Climatic response and impact of drought on frequently used tree species. Trees 2014, 28, 1079–1093. [Google Scholar] [CrossRef]
- Doick, K.; Hutchings, T. Air temperature regulation by urban trees and green infrastructure. For. Res. 2013, 12, 1–10. Available online: https://cdn.forestresearch.gov.uk/2013/03/fcrn012.pdf. (accessed on 10 December 2022).
- Day, S.; Bassuk, N. A review of the effects of soil compaction and amelioration techniques on landscape trees. J. Arboric. 1994, 20, 9–17. [Google Scholar] [CrossRef]
- Gilman, E. Effects of amendments, soil additives, and irrigation on tree survival and growth. J. Arboric. 2004, 30, 301–304. [Google Scholar] [CrossRef]
- Entwisle, T.J.; Cole, C.; Symes, P. Adapting the botanical landscape of Melbourne Gardens (Royal Botanic Gardens Victoria) in response to climate change. Plant Divers. 2017, 39, 338–347. [Google Scholar] [CrossRef] [PubMed]
- Morar, T.; Luca, E.; Petrache, A.; Culescu, D. Tree inventory in the historical garden of Teleki castle using the tree plotter software. Agric. Rev. Știință Pract. Agric. 2019, 111, 418–422. [Google Scholar] [CrossRef]
- Çinar, H.; Guzel, M. Investigation on rational use of water in a palace garden: A case of Dolmabahce Palace (Mabeyn Garden). Fresenius Environ. Bull. 2020, 29, 6469–6478. [Google Scholar]
- Cheney, J.; Navarrete, J.; Wyse Jackson, P. Action Plan for Botanic Gardens in the European Union; Ministry for SMEs and Agriculture, Directorate of Research and Development, National Botanic Garden of Belgium: Meise, Belgium, 2000.
- Evans, P.S.; Klett, J.E. The effects of dormant branch thinning on total leaf, shoot, and root production from bare-root Prunus cerasifera ‘Newport’. J. Arboric. 1985, 11, 298–302. [Google Scholar]
- Gilman, E.; Grabosky, J. Branch union morphology affects decay following pruning. Arboric. Urban For. 2006, 32, 74–79. [Google Scholar] [CrossRef]
- Clark, J.; Matheny, N. The Research Foundation to tree pruning: A review of the literature. Arboric. Urban For. 2010, 36, 110–120. [Google Scholar] [CrossRef]
- Berg, M.P.; Ellers, J. Trait plasticity in species interactions: A driving force of community dynamics. Evol. Ecol. 2010, 24, 617–629. [Google Scholar] [CrossRef] [Green Version]
- Richter, S.; Kipfer, T.; Wohlgemuth, T.; Calderón Guerrero, C.; Ghazoul, J.; Moser, B. Phenotypic plasticity facilitates resistance to climate change in a highly variable environment. Oecologia 2012, 169, 269–279. [Google Scholar] [CrossRef]
- Anderegg, W.R.L.; Anderegg, L.D.L.; Kerr, K.L.; Trugman, A.T. Widespread drought-induced tree mortality at dry range edges indicates that climate stress exceeds species’ compensating mechanisms. Glob. Chang. Biol. 2019, 25, 3793–3802. [Google Scholar] [CrossRef]
- Delucia, E.H.; Maherali, H.; Carey, E.V. Climate-driven changes in biomass allocation in pines. Glob. Chang. Biol. 2000, 6, 587–593. [Google Scholar] [CrossRef]
- Markesteijn, L.; Poorter, L. Seedling root morphology and biomass allocation of 62 tropical tree species in relation to drought- and shade-tolerance. J. Ecol. 2009, 97, 311–325. [Google Scholar] [CrossRef]
- López, R.; López de Heredia, U.; Collada, C.; Cano, F.J.; Emerson, B.C.; Cochard, H.; Gil, L. Vulnerability to cavitation, hydraulic efficiency, growth and survival in an insular pine (Pinus canariensis). Ann. Bot. 2013, 111, 1167–1179. [Google Scholar] [CrossRef] [PubMed] [Green Version]
- Anderegg, W.R.L. Spatial and temporal variation in plant hydraulic traits and their relevance for climate change Impacts on Vegetation. New Phytol. 2015, 205, 1008–1014. [Google Scholar] [CrossRef] [PubMed]
- Royal Botanic Gardens Victoria. Landscape Succession Strategy Melbourne Gardens 2016–2036. Available online: https://www.rbg.vic.gov.au/media/p41mwqcw/landscape_succession_strategy_lo_res1.pdf (accessed on 23 December 2022).
Figure 1.
(a) The geographical localization of the Botanic Garden and Museum of the University of Pisa and its planimetry; pictures of the two oldest trees of the botanical garden: (b) Magnolia grandiflora L. and (c) Gingko biloba L., both planted in 1787.
Figure 1.
(a) The geographical localization of the Botanic Garden and Museum of the University of Pisa and its planimetry; pictures of the two oldest trees of the botanical garden: (b) Magnolia grandiflora L. and (c) Gingko biloba L., both planted in 1787.

Figure 2.
Risk category frequencies (%) assessed through the two models (GBIF BGCI and Plant Search) for the trees cultivated in the Botanic Garden and Museum of the University of Pisa. For each model, the current climate and the two scenarios (SSP2/RCP4.5 forecast to 2050 and SSP3/RCP7.0 forecast to 2090) are contrasted. Risk codes vary along an ordinal scale from 3 to 0, with the extremes indicating a species known (risk code 3, in green) or not known (risk code 0, in red) to occur at the predicted mean annual temperature of the botanical garden’s location.

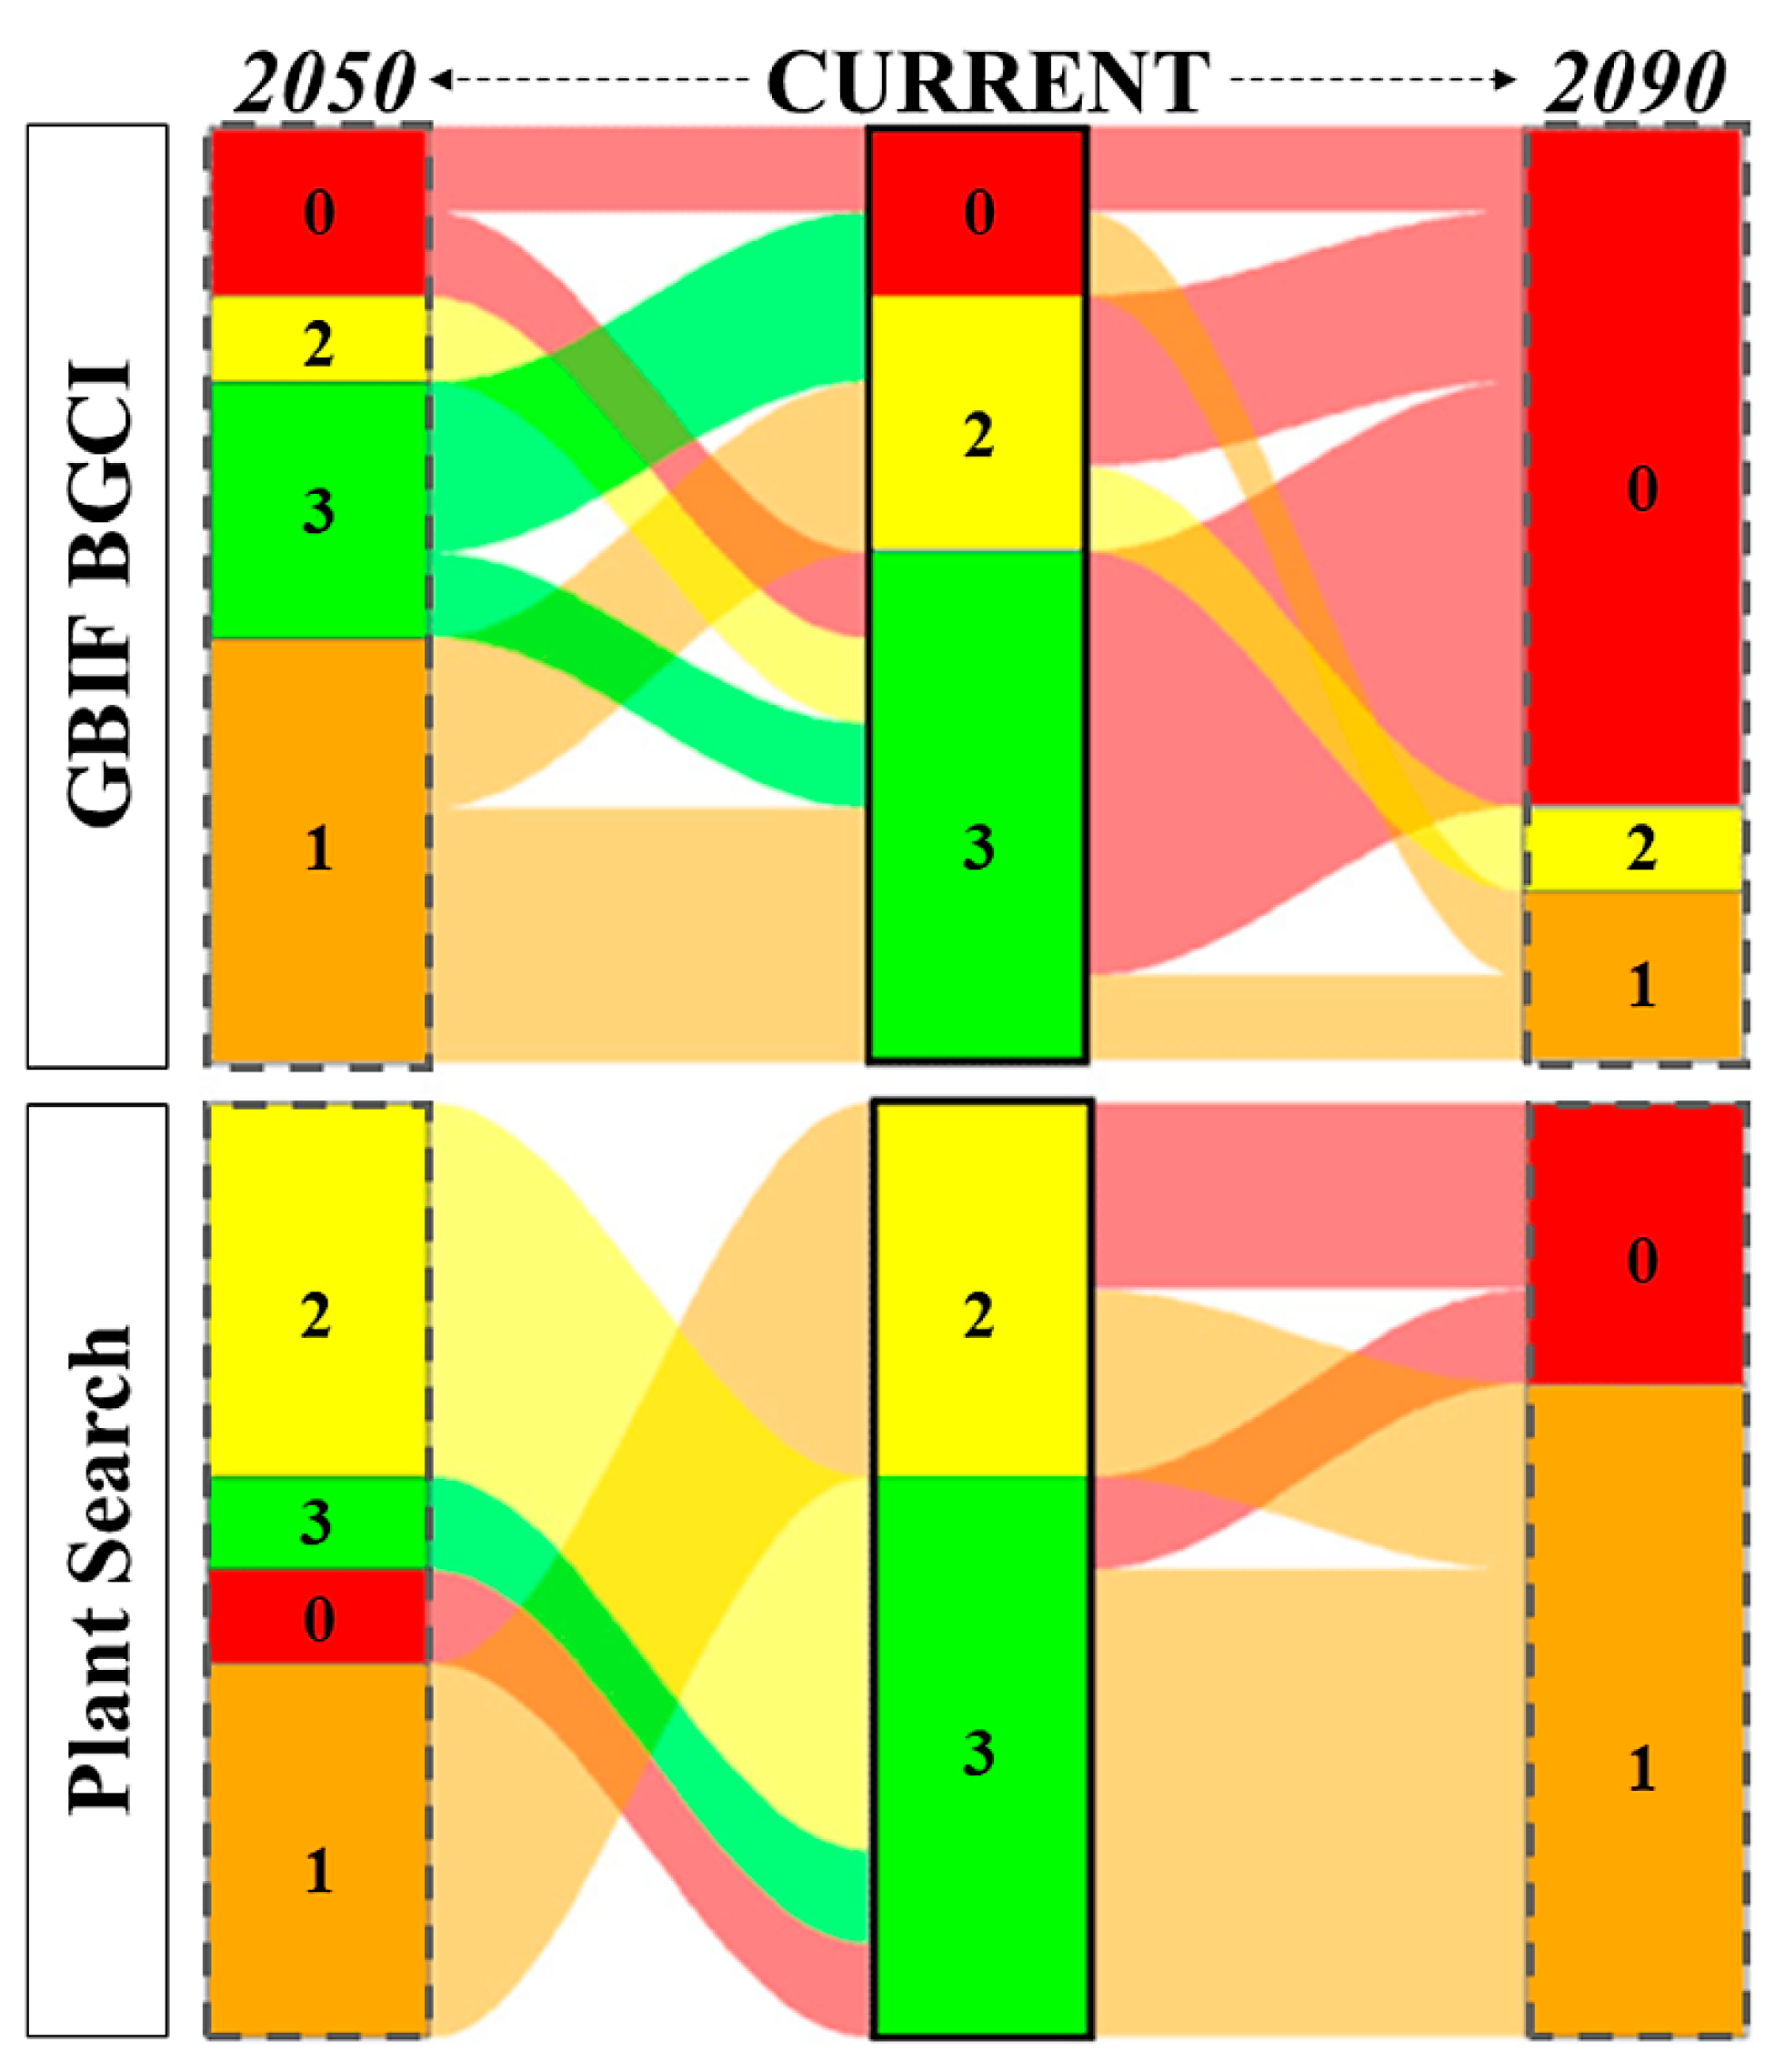
Figure 3.
Alluvial diagram representing the shifts in risk category between the current climate (central column, in bold) and the following years: 2050 (scenario SSP2/RCP4.5; on the left) and 2090 (scenario SSP3/RCP7.0; on the right). Risk codes vary along an ordinal scale from 3 to 0, with the extremes indicating a species known (risk code 3, in green) or not known (risk code 0, in red) to occur at the predicted mean annual temperature of the botanical garden’s location, respectively. Risk code 1 is colored in orange, while risk code 2 in yellow.

Figure 4.
Density distribution of optimal environmental variables for the trees currently in cultivation in the Botanic Garden of the University of Pisa, according to two different occurrence record datasets: GBIF BGCI (in yellow) and Plant Search (in purple). The analyzed climatic variables are as follows: (a) maximum temperature of the hottest month (BIO5), (b) minimum temperature of the coldest quarter (BIO11), (c) annual precipitation (BIO12), and (d) precipitation of the driest quarter (BIO17). Vertical lines represent the predicted values of the environmental variable (continuous line for current condition, long dashed line for the scenario SSP2/RCP4.5 forecast to 2050, and dotted line for SSP3/RCP7.0 forecast to 2090.

Figure 5.
Climate vulnerability assessment maps of the trees cultivated in the Botanic Garden of the University of Pisa, showing the risk categories according to an ordinal scale ranging from 0 (maximum risk) to 3 (minimum risk).
Figure 5.
Climate vulnerability assessment maps of the trees cultivated in the Botanic Garden of the University of Pisa, showing the risk categories according to an ordinal scale ranging from 0 (maximum risk) to 3 (minimum risk).


Table 1.
Overall trends resulted by pairwise comparison for each tree cultivated in the Botanic Garden and Museum of the University of Pisa. The ‘Stable’ category indicates that the tree maintains the same category risks in the forecast climatic scenario, while ‘Worsening’ and ‘Improving’ show an expected lowering or increasing of the risk category, respectively.
| Model | Scenario | Worsening (%) | Stable (%) | Improving (%) |
|---|---|---|---|---|
| GBIF BGCI | SSP2/RCP4.5 (2050) | 36.5 | 27.5 | 36.0 |
| Plant Search | SSP3/RCP7.0 (2050) | 49.0 | 50.5 | 0.5 |
| GBIF BGCI | SSP2/RCP4.5 (2090) | 51.9 | 21.7 | 26.5 |
| Plant Search | SSP3/RCP7.0 (2090) | 95.9 | 4.1 | 0.0 |
Disclaimer/Publisher’s Note: The statements, opinions and data contained in all publications are solely those of the individual author(s) and contributor(s) and not of MDPI and/or the editor(s). MDPI and/or the editor(s) disclaim responsibility for any injury to people or property resulting from any ideas, methods, instructions or products referred to in the content. |
© 2023 by the authors. Licensee MDPI, Basel, Switzerland. This article is an open access article distributed under the terms and conditions of the Creative Commons Attribution (CC BY) license (https://creativecommons.org/licenses/by/4.0/).
Share and Cite
MDPI and ACS Style
D’Antraccoli, M.; Weiger, N.; Cocchi, L.; Peruzzi, L. The Trees of the Pisa Botanic Garden under Climate Change Scenarios: What Are We Walking into? Sustainability 2023, 15, 4585. https://doi.org/10.3390/su15054585
AMA Style
D’Antraccoli M, Weiger N, Cocchi L, Peruzzi L. The Trees of the Pisa Botanic Garden under Climate Change Scenarios: What Are We Walking into? Sustainability. 2023; 15(5):4585. https://doi.org/10.3390/su15054585
Chicago/Turabian StyleD’Antraccoli, Marco, Nóra Weiger, Leonardo Cocchi, and Lorenzo Peruzzi. 2023. "The Trees of the Pisa Botanic Garden under Climate Change Scenarios: What Are We Walking into?" Sustainability 15, no. 5: 4585. https://doi.org/10.3390/su15054585
Note that from the first issue of 2016, this journal uses article numbers instead of page numbers. See further details here.